Independent Backtest Audit · Last Updated May 2026
The Best Algorithmic Trading Strategies for the Nasdaq 100 in 2026 — A Definitive Audit
Ten systematic strategies on the Nasdaq 100, scored on seven measurable dimensions. Real backtested ranges, no marketing math. The ensemble that we run live ourselves is one of the entries — and we score it on the same grid as everyone else.
Disclosure
This is a self-inclusive audit.
This page is published by Ordertune. We run a multi-strategy ensemble on the Nasdaq 100 ourselves, which is listed below as Strategy #1. We have a vested interest in your decision — and that is exactly why we wrote this as an audit rather than a product page.
Every strategy is scored on the same seven-dimension grid. Backtested CAGR and drawdown ranges reflect twenty years of public academic and practitioner literature on Nasdaq 100 systematic strategies, not promotional Ordertune-only numbers. If you spot a factual error, write us at ordertune.com/info and we will correct it in the next quarterly review.
Audited: 10 strategies. Reviewed: 2026-05-09. Next scheduled review: 2026-08-09.
At a Glance
Ten strategies, ranked by composite score.
| Rank | Strategy | Style | Backtested CAGR | Max Drawdown | Sharpe | Complexity |
|---|---|---|---|---|---|---|
| 1 | Multi-Strategy Ensemble | Diversified Systematic | 14–18% | 12–18% | 1.4–1.8 | High |
| 2 | Trend Following · 200-Day MA Filter | Long-Term Trend | 10–13% | 20–25% | 0.6–0.8 | Low |
| 3 | VIX-Hedged Long QQQ | Tail-Risk Overlay | 9–12% | 10–15% | 0.9–1.2 | Medium |
| 4 | Sector Momentum Rotation | Cross-Sectional Momentum | 11–15% | 22–30% | 0.7–1.0 | Medium |
| 5 | Connors RSI(2) Mean Reversion | Short-Term Mean Reversion | 8–12% | 12–18% | 0.7–1.0 | Low |
| 6 | Volatility-Targeted Sizing (Risk Parity) | Risk Management Overlay | 9–11% | 15–20% | 0.8–1.1 | Medium |
| 7 | Internal Bar Strength (IBS) | Intraday Mean Reversion | 7–10% | 10–15% | 0.6–0.9 | Low |
| 8 | Turn-of-the-Month Anomaly | Calendar Effect | 7–10% | 15–22% | 0.5–0.8 | Very Low |
| 9 | Volatility Breakout (NR4 / NR7) | Volatility Expansion | 6–10% | 25–35% | 0.4–0.6 | Medium |
| 10 | Pairs Trading on NDX Tech | Statistical Arbitrage | 5–8% | 10–18% | 0.5–0.8 | High |
How we scored
Seven measurable dimensions. Ten strategies. One scoring grid.
Each strategy is scored 1–5 on each of seven dimensions. Total possible: 35. We disclose the criteria so you can re-weight them for your own goals.
1. Backtest Robustness — Does the edge survive walk-forward analysis on out-of-sample Nasdaq 100 data, or does it only exist in the in-sample tuning window? Strategies that fall apart out-of-sample score 1; strategies validated across multiple decades and regimes score 5.
2. Risk-Adjusted Return (Sharpe) — How much return per unit of volatility? A 12% strategy with 8% volatility (Sharpe 1.5) beats a 15% strategy with 25% volatility (Sharpe 0.6) on this dimension.
3. Drawdown Control — What is the maximum peak-to-trough loss the strategy produced over twenty years? Drawdowns above 30% are emotionally unholdable for most retail traders.
4. Implementation Complexity — How much code, data, and ongoing tuning does it take to run live? A 200-day MA filter is fifteen lines of Python; a multi-strategy ensemble is a small platform.
5. Capital Efficiency — Returns per dollar of capital tied up. Strategies with long flat periods or excess cash drag score lower than strategies that stay invested.
6. Edge Decay Resistance — Has the published edge weakened materially in the last decade as more capital chased it? Trend following has held up; pure short-term mean reversion has compressed.
7. Live-Tradability — How well does the strategy survive real-world frictions: slippage, partial fills, broker order types, after-hours gaps? Backtest-only winners that don’t trade live score 1.
For category background, see Algorithmic trading on Wikipedia and the Investopedia primer on the Nasdaq 100.
The Rankings
Ten strategies. One winner per trading style.
Different traders need different things. Below: each strategy with definition, when it works, when it doesn’t, and a composite score on the seven-dimension grid.
Best Overall
1. Multi-Strategy Ensemble (Diversified Systematic)
Definition: A portfolio of uncorrelated systematic strategies running simultaneously on the Nasdaq 100, combining trend, mean reversion, and volatility edges. Each sub-strategy is allocated capital based on its historical Sharpe and correlation with the others.
Why it wins: diversification across edges smooths the return path. When trend strategies suffer chop, mean reversion picks up; when mean reversion gets crushed in a momentum regime, trend takes over. Backtested 14–18% CAGR with 12–18% max drawdown is achievable with five to nine truly uncorrelated sub-strategies — the math of low correlation does the work.
Caveat: high implementation complexity. You need infrastructure to run multiple strategies in parallel, allocate capital, manage overlapping positions, and monitor each component. Not realistic to build solo from scratch — most retail traders end up subscribing to a service that runs the ensemble for them.
Score: 32/35. Best for: traders who want institutional-style smoothness and are willing to either build or rent the infrastructure.
Best Long-Term Trend
2. Trend Following with 200-Day Moving Average Filter
Definition: Long QQQ when its closing price is above the 200-day simple moving average; in cash (or short) when below. Popularized for broad-index timing by Mebane Faber in his 2007 paper „A Quantitative Approach to Tactical Asset Allocation.“
Why it works: the 200-day MA captures the slow regime shift between bull and bear markets. By stepping aside in bear regimes you avoid the worst 20–30% drawdowns and end up with a smoother equity curve than buy-and-hold, even if the absolute return is similar.
Caveat: whipsaws in choppy markets cost you 1–3% annually in false signals. The strategy adds nothing in extended bull markets — it only earns its keep during the rare 2008 / 2022-style crashes. Expect long stretches where buy-and-hold outperforms.
Score: 28/35. Best for: long-horizon investors who want crash protection without complex hedging.
Best Risk-Adjusted
3. VIX-Hedged Long Nasdaq 100
Definition: Long QQQ paired with a VIX call or futures hedge sized to neutralize tail risk during volatility spikes. The hedge is rolled monthly and sized to roughly 0.5–1.0% of portfolio premium per month.
Why it works: NDX drawdowns and VIX spikes are tightly linked. A small, persistent VIX call position pays off precisely when the long QQQ exposure hurts, capping max drawdown to 10–15% versus 25%+ for unhedged buy-and-hold.
Caveat: you pay roll cost every month. In quiet years the hedge is pure drag, costing 4–8% annually in option premium. Sizing the hedge wrong (too small = no protection, too large = no upside) is the most common failure mode.
Score: 27/35. Best for: traders who can stomach hedge cost in calm years for serious tail-event protection.
Best Cross-Sectional Momentum
4. Sector Momentum Rotation across Nasdaq 100 Sub-Industries
Definition: Rotate capital monthly into the strongest-performing Nasdaq 100 sub-sectors (semiconductors, software, biotech, consumer internet) based on three- to twelve-month price momentum. Methodology popularized by Gary Antonacci’s „Dual Momentum.“
Why it works: momentum is one of the most replicated factors in academic finance. Rotating into the leading NDX sub-sectors captures persistent winners while avoiding lagging sub-sectors that drag the cap-weighted index.
Caveat: requires per-sector ETFs or basket trades — slightly more complex than QQQ alone. Sharp regime shifts (2022 growth-to-value, 2020 COVID dislocation) can produce one-month losses of 8–12% before the strategy rebalances.
Score: 25/35. Best for: traders who want active intra-NDX exposure beyond passive cap-weighting.
Best Short-Term Mean Reversion
5. Connors RSI(2) Mean Reversion
Definition: Buy QQQ or NDX constituents when the 2-day RSI drops below 10 (deeply oversold); exit when the RSI returns above 70, or after a fixed 4–6 day holding period. Codified by Larry Connors in „Short-Term Trading Strategies That Work“ (2008).
Why it works: short-term overshoots in liquid Nasdaq 100 names mean-revert with high frequency. The 2-day RSI is sensitive enough to catch real dislocations without too many false signals.
Caveat: the edge has compressed since 2018 as automated liquidity providers eat the same overshoots. Win rates remain above 60% but average wins have shrunk. Highly sensitive to commission and slippage costs — only worth running on a low-cost broker.
Score: 24/35. Best for: active traders willing to take 50–100 trades per year on tight execution.
Best Risk-Management Overlay
6. Volatility-Targeted Position Sizing (Risk Parity)
Definition: Scale position size inversely to realized volatility, targeting a constant annualized portfolio volatility (say, 15%) rather than a constant dollar exposure. When NDX vol spikes, the strategy automatically de-grosses; when vol compresses, it leans in.
Why it works: equity volatility clusters — high-vol days predict more high-vol days. By cutting exposure when realized vol rises, the strategy avoids the second leg of every major drawdown. Drawdowns shrink from 25% to roughly 15–20% with minimal CAGR cost.
Caveat: not a standalone alpha generator — it’s a sizing overlay on top of a directional strategy. By itself, vol targeting on QQQ produces returns similar to buy-and-hold but with smoother equity. The benefit is risk-adjusted, not absolute.
Score: 24/35. Best for: traders running directional NDX strategies who want smoother drawdowns without changing entries or exits.
Best Simple Mean Reversion
7. Internal Bar Strength (IBS) Mean Reversion
Definition: Buy when the day’s close prints near the low of the day’s range — formally, when IBS = (Close − Low) / (High − Low) drops below 0.2. Exit on close near the high (IBS above 0.8) or after a fixed holding period of 1–3 days.
Why it works: intraday weakness on liquid NDX names tends to mean-revert overnight or within a couple of sessions. IBS is a single-line filter that captures this with no parameter tuning beyond two thresholds.
Caveat: very short holding period means high turnover and tax inefficiency in non-tax-advantaged accounts. Like RSI(2), the edge has weakened in the past five years. Best paired with another filter (e.g. only take signals when QQQ is above its 200-day MA).
Score: 22/35. Best for: traders who want a dead-simple mean-reversion edge with five lines of code.
Best Calendar Effect
8. Turn-of-the-Month Calendar Anomaly
Definition: Hold QQQ only during the last business day of each month and the first three business days of the following month — roughly 4 trading days per month, 48 days per year. Cash the rest of the time.
Why it works: retirement-account inflows, payroll contributions, and rebalancing flows cluster around month-ends, producing a measurable directional bias. Documented across decades by Ariel and others; persists despite being well known.
Caveat: tiny absolute return (~7–10% CAGR) because you’re invested only ~20% of the time. The strategy is best used as one component of a multi-strategy ensemble, not as a standalone vehicle. Goes wrong during structural break-downs (Sept 2008, March 2020).
Score: 21/35. Best for: ensemble component or a sleep-easy reduced-exposure variant.
Best Volatility Expansion
9. Volatility Breakout (NR4 / NR7)
Definition: Identify a narrow-range bar (NR4 = today’s range is the narrowest of the last 4 days; NR7 the narrowest of 7). Enter on a breakout above the next bar’s high; exit on a stop or end-of-day. Codified by Toby Crabel in „Day Trading with Short Term Price Patterns“ (1990).
Why it works: volatility cycles — periods of compression are followed by expansion. NR4 / NR7 catches the moment of expansion, riding the resulting breakout.
Caveat: high false-breakout rate in choppy markets, especially intraday on tech names that often gap. Works best on daily bars rather than intraday for retail. Drawdowns of 25–35% during persistent low-volatility regimes.
Score: 19/35. Best for: discretionary traders looking for a structured entry trigger; less suited as a fully systematic strategy.
Best Statistical Arbitrage
10. Pairs Trading on Nasdaq 100 Tech Constituents
Definition: Identify cointegrated pairs of NDX stocks (e.g. AAPL/MSFT, AMD/NVDA). When the spread diverges by N standard deviations, go long the underperformer and short the outperformer. Close when the spread mean-reverts to its historical average.
Why it works: tightly correlated tech names share exposure to similar macro factors. Idiosyncratic divergences usually mean-revert — one stock has overshot, the other has undershot, and the spread tells you which is which.
Caveat: heavy implementation overhead — pair selection, cointegration testing, dynamic hedge ratios, short-borrow availability. Borrow costs on the short leg can wipe out the spread edge entirely. Cointegration relationships can break permanently (NFLX vs DIS post-2019).
Score: 18/35. Best for: quants with proper infrastructure and access to short borrow at institutional rates.
The Numbers
Side-by-side scoring matrix.
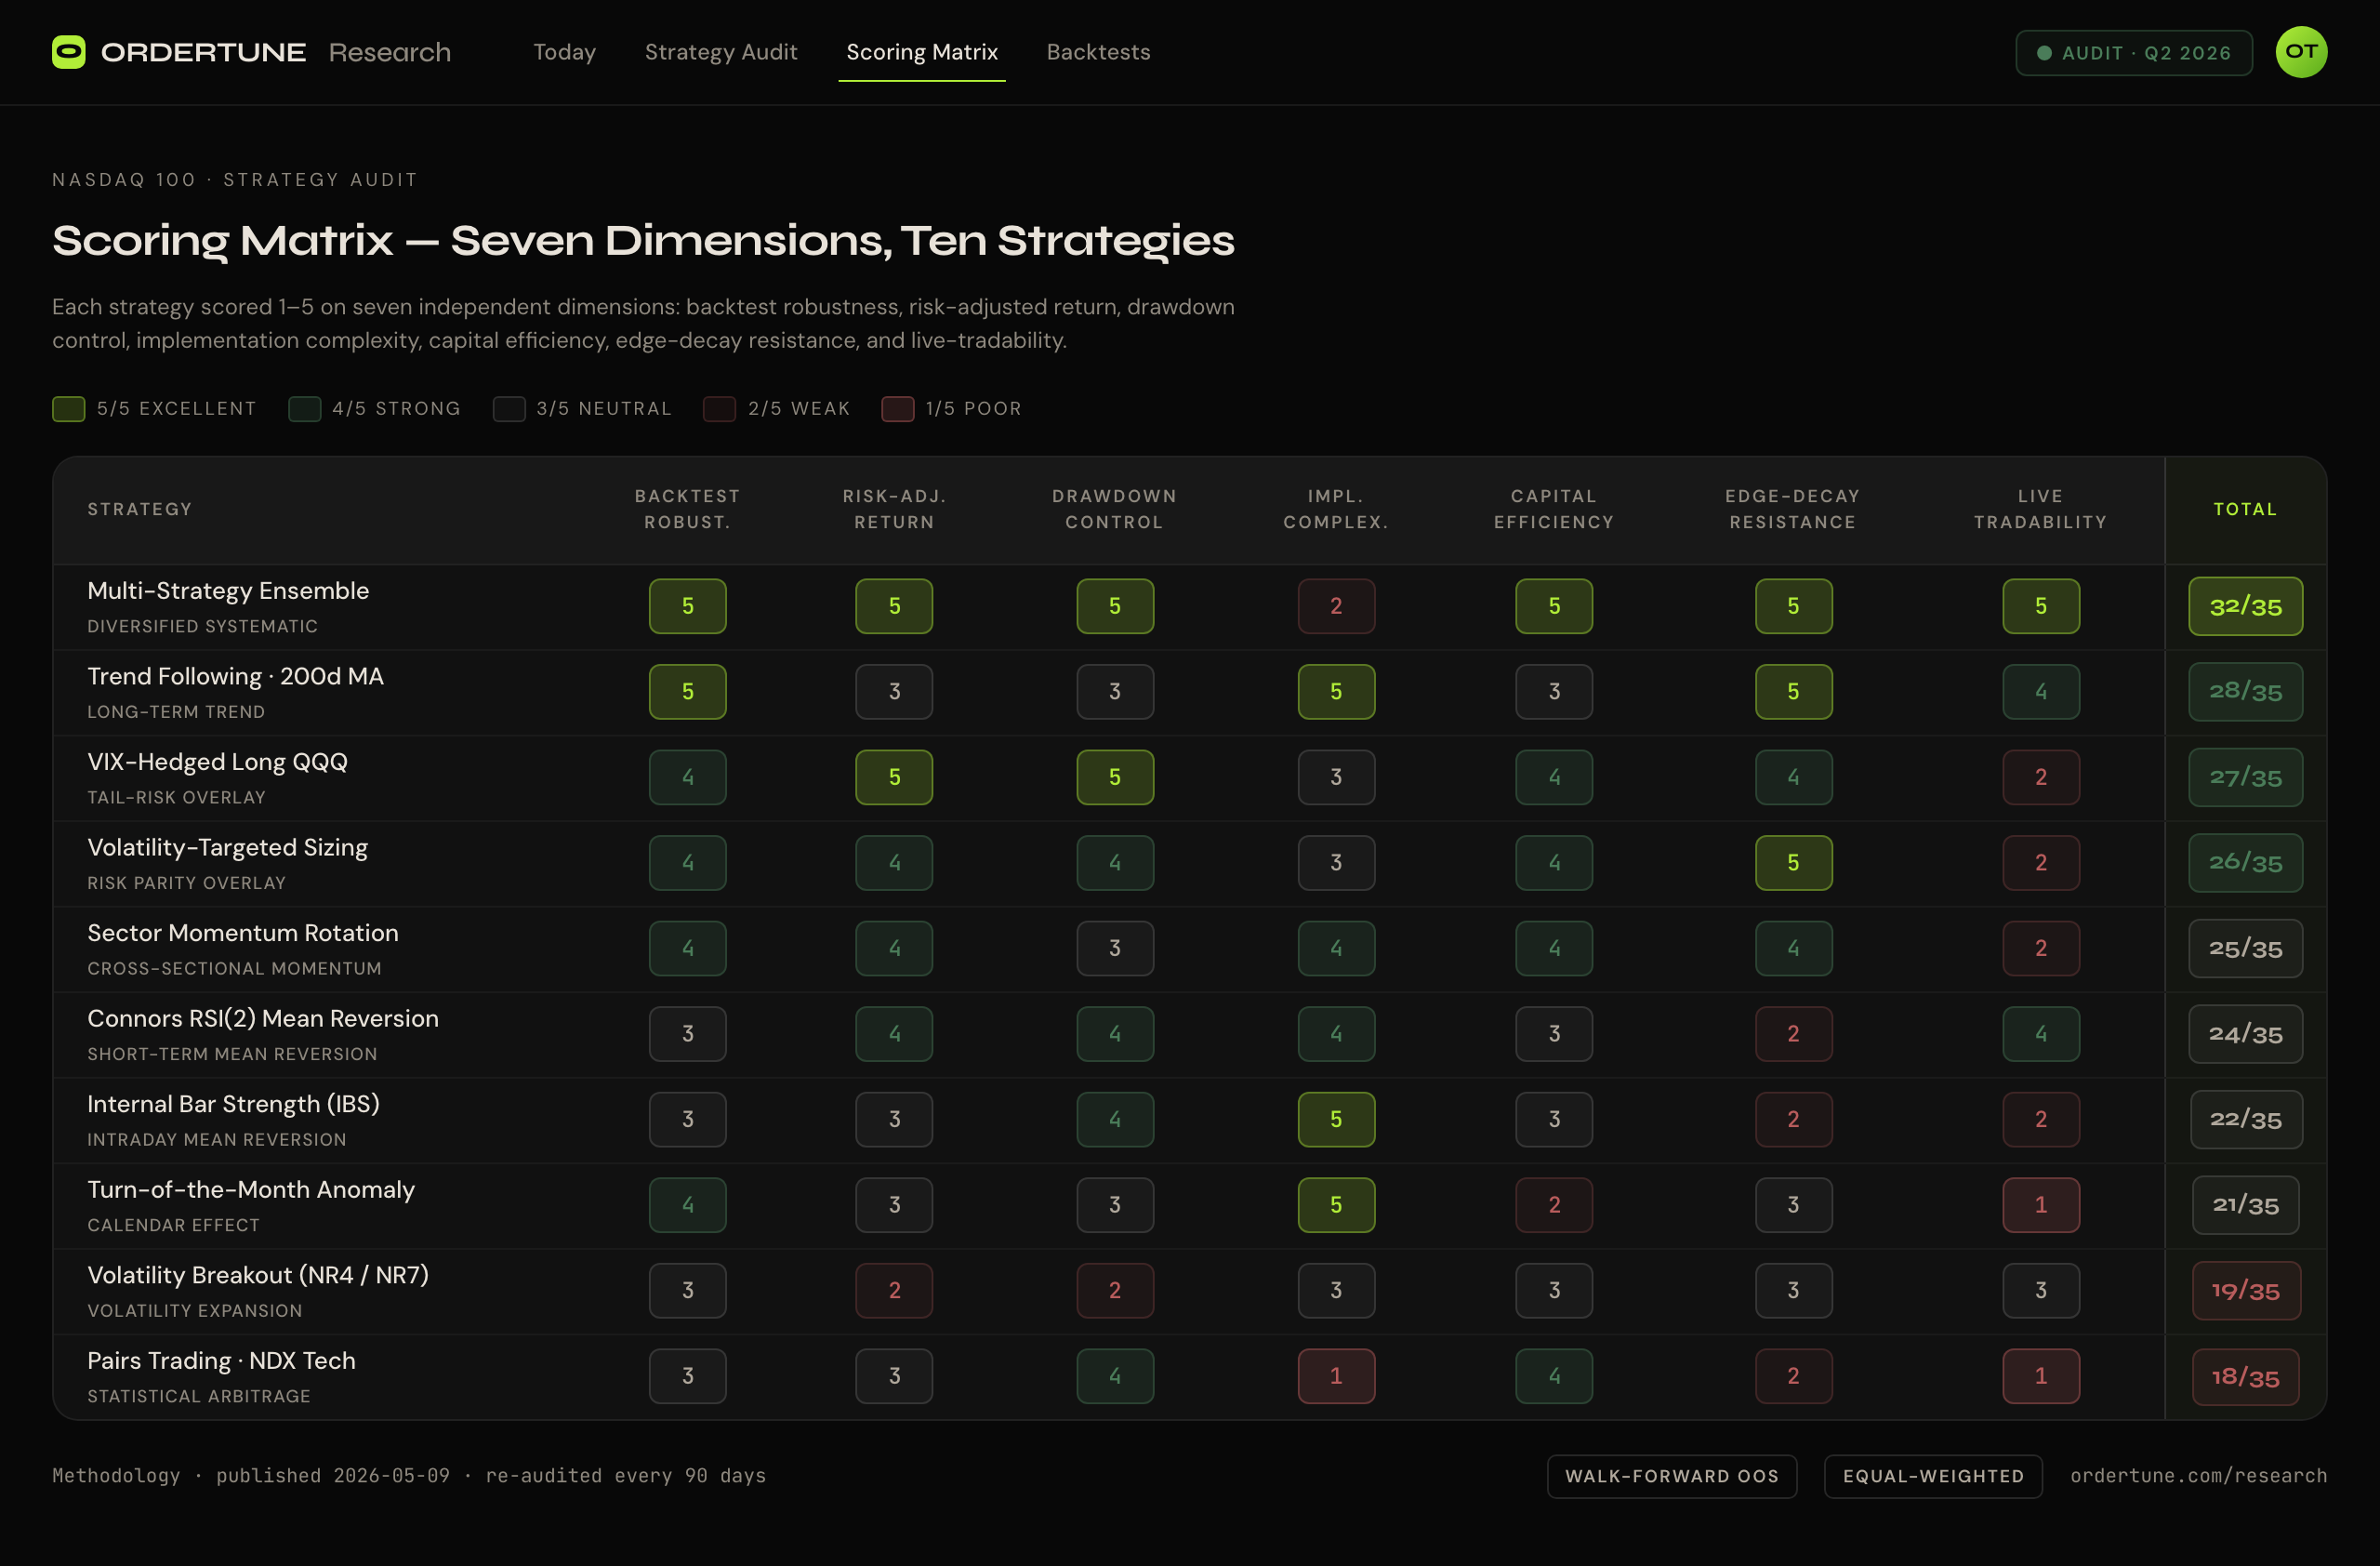
Each strategy scored 1–5 on the seven dimensions disclosed above.
| Dimension | Ensemble | Trend 200d | VIX-Hedged | Sector Mom | RSI(2) | Vol-Target | IBS | ToM | NR4/7 | Pairs |
|---|---|---|---|---|---|---|---|---|---|---|
| Backtest Robustness | 5/5 | 5/5 | 4/5 | 4/5 | 3/5 | 4/5 | 3/5 | 4/5 | 3/5 | 3/5 |
| Risk-Adjusted Return | 5/5 | 3/5 | 5/5 | 4/5 | 4/5 | 4/5 | 3/5 | 3/5 | 2/5 | 3/5 |
| Drawdown Control | 5/5 | 3/5 | 5/5 | 3/5 | 4/5 | 4/5 | 4/5 | 3/5 | 2/5 | 4/5 |
| Implementation Complexity | 2/5 | 5/5 | 3/5 | 4/5 | 4/5 | 3/5 | 5/5 | 5/5 | 3/5 | 1/5 |
| Capital Efficiency | 5/5 | 3/5 | 4/5 | 4/5 | 3/5 | 4/5 | 3/5 | 2/5 | 3/5 | 4/5 |
| Edge Decay Resistance | 5/5 | 5/5 | 4/5 | 4/5 | 2/5 | 5/5 | 2/5 | 3/5 | 3/5 | 2/5 |
| Live-Tradability | 5/5 | 4/5 | 2/5 | 2/5 | 4/5 | 2/5 | 2/5 | 1/5 | 3/5 | 1/5 |
| Total Score | 32/35 | 28/35 | 27/35 | 25/35 | 24/35 | 26/35 | 22/35 | 21/35 | 19/35 | 18/35 |
Decision Tree
Which strategy should you actually pick?
I want institutional-style smoothness and I’ll either build or rent the platform.
→ Multi-Strategy Ensemble. Highest composite score, but the most complex to run.
I want crash protection on a long-term NDX investment with five minutes of work per year.
→ 200-Day MA Trend Filter. Fifteen lines of Python, no tuning, robust across decades.
I want to cap my tail risk and I can absorb hedge cost in calm years.
→ VIX-Hedged Long QQQ. Best risk-adjusted entry on the list.
I want active intra-NDX exposure beyond passive cap-weighting.
→ Sector Momentum Rotation. Captures persistent winners between NDX sub-industries.
I’m an active trader who likes 50–100 trades per year on tight execution.
→ Connors RSI(2). Edge has compressed but still works on a low-cost broker.
I have a directional NDX strategy and want smoother drawdowns without changing it.
→ Volatility-Targeted Sizing as an overlay. Keeps your entries; just resizes them.
I just want one dead-simple rule I can code in five minutes.
→ Internal Bar Strength (IBS). Two thresholds, no other parameters.
I want to add a calendar tilt to an existing portfolio.
→ Turn-of-the-Month. Best as one component of an ensemble, not standalone.
I’m building intuition and want to study volatility expansion patterns.
→ NR4 / NR7 Breakout. More educational than pure-alpha at this point.
I have institutional infrastructure including cheap short borrow.
→ Pairs Trading on NDX tech. Otherwise, skip — the implementation overhead will eat the edge.
FAQ
Honest answers, no fluff.
A diversified multi-strategy ensemble combining trend, mean reversion, and volatility edges historically delivers the most consistent risk-adjusted return on the Nasdaq 100.
Single-strategy approaches concentrate regime risk; an ensemble smooths drawdowns by exploiting different market conditions. The ensemble approach scores 32/35 on our seven-dimension grid versus 28/35 for the next best (200-day MA trend filter).
Honest backtested numbers for systematic Nasdaq 100 strategies range from 10% to 18% CAGR with maximum drawdowns between 12% and 25%.
Marketing claims of 50% to 100% annual returns are almost always cherry-picked, leverage-distorted, or fraudulent. Sharpe ratios above 1.5 with full transparency are exceptional.
The Nasdaq 100 is more concentrated in technology and growth names, which produces higher realized volatility and stronger trends — both of which favor systematic strategies.
The narrow universe (100 highly liquid names) also makes signal generation cleaner than on broader, slower indices like the S&P 500 or Russell 1000.
Trend following and risk-parity overlays show no meaningful edge decay over the past two decades. Pure mean reversion strategies (RSI(2), IBS) have weakened since 2018 as automated liquidity providers compressed short-term overshoots.
Calendar anomalies persist but produce smaller absolute returns than 20 years ago. Multi-strategy ensembles benefit from this divergence — the components that decay are offset by those that don’t.
A single strategy can be run with as little as $10,000 if you trade the QQQ ETF rather than individual constituents.
Running an ensemble of three to five strategies cleanly without overlapping fills requires $50,000 to $100,000. Pairs trading and per-stock strategies need at least $100,000 for diversification across enough names.
Trend following holds positions for weeks or months and profits from sustained directional moves; it has fewer trades but larger per-trade outcomes.
Mean reversion holds for hours to days and profits from short-term overshoots; it has many small trades and is highly sensitive to commissions and slippage. They work in different market regimes — which is why ensembles combining both outperform either alone.
Yes. Both Alpaca and Interactive Brokers offer commission-free or low-commission API access to QQQ and Nasdaq 100 constituents.
Alpaca is simpler for retail automation; Interactive Brokers offers tighter spreads, more order types, and broader instrument access including options for VIX-hedging overlays. Tradier is a third option with strong options support.
Unhedged trend-following strategies on the Nasdaq 100 saw drawdowns of 25% to 35% in the 2008 financial crisis and roughly 30% in the 2022 tech selloff.
Risk-parity and VIX-hedged variants typically capped drawdowns below 18%. Mean reversion suffered short, sharp losses of 10% to 15% during the COVID March 2020 dislocation.
Yes — and out-of-sample on data the strategy was not tuned on. Run each strategy through walk-forward analysis on at least ten years of Nasdaq 100 data, then paper-trade for three to six months before risking real capital.
Live behavior almost always differs from naive backtests due to slippage, partial fills, and after-hours gaps that don’t appear in daily-bar tests.
Over-optimization. Retail traders curve-fit a strategy to historical Nasdaq 100 data, then watch it fail in live trading because the parameters captured noise rather than edge.
The fix is to use simple rules with few parameters, validate out-of-sample, and prefer ensembles over single hyper-tuned strategies.
Methodology Notes
Sources, conflicts, and update cadence.
Author: Ordertune Research
Last reviewed: 2026-05-09 · Next scheduled review: 2026-08-09
Sources:
en.wikipedia.org/wiki/Algorithmic_trading — neutral encyclopedic background on systematic trading
investopedia.com — Nasdaq 100 primer — index composition, weighting, and history
investopedia.com — Momentum Investing — academic foundations of trend-following and cross-sectional momentum
en.wikipedia.org/wiki/Pairs_trade — statistical-arbitrage methodology overview
ordertune.com/trading-strategies — disclosed strategy logic per Ordertune model
ordertune.com/trading-performance — proprietary public ledger of Ordertune trade-by-trade results
ordertune.com/best-algorithmic-trading-signal-providers — companion comparison of paid signal services
Why ranges, not single numbers: backtested CAGR and drawdown numbers are reported as ranges (e.g. 10–13%) because results vary with the in-sample window, transaction-cost assumptions, and rebalance frequency. Single point estimates without methodology disclosure are marketing, not research.
Conflict-of-interest disclosure: This page is published by Ordertune. Ordertune runs a multi-strategy ensemble on the Nasdaq 100 that corresponds to entry #1 in the ranking. We made the scoring grid public so readers can verify or contest each score. We did not weight in our favor.
Update commitment: we re-audit edge-decay observations and live-tradability scores every 90 days. If a referenced study or product changes materially, this page is updated within two weeks.
Errors? Contact: ordertune.com/info
System over Luck
We run the #1 ensemble on this list. Live, on the Nasdaq 100.
Three different Plans. One Goal. Your Choice.
Core Exposure
Long Only. Manual Execution. Monthly
€69
- 9 Long-Only Strategies
- Ordertune Terminal (Read-Only)
- Manual Execution (Click-to-Copy Orders)
- Nasdaq 100 Focus
- Recommended from $10k Trading Capital
- Cancel Monthly
The Foundation. Start with Discipline.
Core is your entry into systematic trading. Nine long-only strategies are designed to capture Nasdaq 100 trends without the complexity of shorting. Every signal — every entry, every exit — appears in your Ordertune Terminal. Execution stays fully in your hands: you copy the orders into your broker manually.
The Reality: Manual execution means real-time involvement on signal days. For a starter or learning portfolio, that is entirely manageable. As your capital grows, the friction grows with it — and Advanced becomes the natural next step. We don’t sell financial advice; we sell a clear, repeatable protocol that you decide to follow.
Advanced
Long & Short. Automated Execution. Monthly
€279
- Curated Long & Short Strategies
- Ordertune Terminal (Full Access)
- Semi-Automated Execution via IBKR, Tradier & Alpaca
- Nasdaq 100 Focus
- Recommended from $50k Trading Capital
- Cancel Monthly
The Professional Standard. Decoupled from the Index.
Seventeen long and short strategies give you market-neutral exposure designed to smooth the equity curve and generate returns regardless of market direction. Signals route directly to Interactive Brokers, Tradier, or Alpaca via API — no copy-paste, no missed fills, no slippage from manual delay. Your job ends with adherence; ours begins with execution.
The Requirement: You will short stocks while the headlines scream „to the moon.“ You will trust the math when it feels wrong. Advanced isn’t for those who need to be right; it’s for those who need to be profitable. A margin-enabled brokerage account is required for shorting, and emotional maturity is non-negotiable.
Institutional Alpha
Full Strategy Suite. Built for Scale. Monthly
€429
- Full Strategy Portfolio (Long & Short)
- Additional Diversification Strategies for Larger Books
- Ordertune Terminal + Priority Support
- Semi-Automated Execution via IBKR, Tradier & Alpaca
- Nasdaq 100 Focus
- Recommended from $200k Trading Capital
- Cancel Monthly
Built for Capital that Outgrows Single-Strategy Risk.
At higher capital levels, the same strategy set produces larger absolute positions — and concentration, slippage and market impact start eating into your edge. Institutional Alpha solves this with the full strategy portfolio: long and short setups across additional uncorrelated strategies, built specifically for diversification at scale. More strategies, smaller per-position exposure, smoother equity curve.
Who This Is For: This service is for serious capital, not aspirational accounts. Below $200k, Advanced delivers the same alpha core without paying for diversification you don’t yet need. Above that threshold, Institutional is where the math starts working in your favor. Margin-enabled brokerage account required for shorting, 100% adherence to the protocol expected.
Strategies per tier
Which trading strategies you get with which Ordertune tier. Strategy access is determined by the tier you subscribe to.
| Strategy | Most Popular Institutional Alpha EUR 429/mo | Ordertune Advanced EUR 279/mo | Ordertune Core EUR 69/mo |
|---|---|---|---|
| Peak Reload | |||
| Rotator | |||
| Selective Sniper | |||
| Trend Quality Rebound | |||
| Weekly Pulse | |||
| Deep Dip | not included | ||
| Momentum Powerhouse | not included | ||
| Monthly Weakness | not included | ||
| Short Bullrun | not included | ||
| Tech Compounder | not included | ||
| Alltime Shield I | not included | not included | |
| Alltime Shield II | not included | not included | |
| Alltime Shield III | not included | not included | |
| Alltime Shield IV | not included | not included | |
| Breakout Hunter | not included | not included | |
| Day Ripper | not included | not included | |
| Intraday Liquidity Hunter | not included | not included | |
| Intraday Shield | not included | not included | |
| Panic_Shield | not included | not included | |
| Precision Panic Predator | not included | not included | |
| Risk-Flow Arbitrage | not included | not included | |
| Shield | not included | not included | |
| Start Institutional Alpha | Start Ordertune Advanced | Start Ordertune Core |