

CAPITAL EFFICIENCY · RECOVERY METRICS
The Elasticity of Capital. Why Recovery Speed Matters as Much as Drawdown Size.
Most risk management discussions are obsessed with one question: “How much can I lose?” Investors scour spreadsheets for the Maximum Drawdown, looking for the deepest pothole in the road. They think that if they can survive the hit, they’ve won the game. The No-BS Reality: risk is not a one-dimensional measurement of depth. It is a two-dimensional measurement of depth and elasticity. A strategy that drops 20% and recovers in two weeks is a minor speed bump. A strategy that drops 10% and takes two years to return to zero is a structural failure of capital efficiency. If your money is spent getting back to even for months on end, you aren’t just losing percentage points—you are losing the most valuable asset in the world: time.
1. The Trap of “Shallow but Slow”
There is a persistent misconception that low volatility equals low risk. This leads traders toward diversified or conservative strategies that display small drawdown numbers in their summary statistics but recover with the speed of a glacier—strategies that appear safe on the spreadsheet and are psychologically corrosive in live trading.
The Flash Crash — High Elasticity: A high-beta strategy in a liquid market might experience a sharp, scary drop during a systemic event. But because the underlying instrument has a structural growth engine and deep liquidity, the recovery is often as aggressive as the decline. Capital is back at work within weeks. The psychological cost is acute but brief. The opportunity cost is minimal.
The Decade of Decay — Low Elasticity: A conservative strategy might only drop 5% during the same event. But because it lacks a clear growth driver or is exposed to illiquid instruments with no natural recovery mechanism, it spends the next eighteen months grinding sideways just to reach its previous high. Capital is not at work. It is doing maintenance. The psychological cost is not acute—it is chronic, and chronic costs compound.
In the real world, the Flash Crash is easier to trade. It allows for faster capital rotation and keeps the opportunity cost of recovery low. The Decade of Decay kills the compounding machine and erodes confidence through pure boredom—the specific psychological condition most likely to produce premature abandonment and rule violations.
2. Capital Utilization: The Efficiency of the Regain
Every day an account is underwater, the capital is effectively unemployed. It is working to repair the past rather than build the future. This is not a metaphor—it is a direct reduction in the Internal Rate of Return of the strategy over any finite holding period.
The Recovery Factor—the ratio of total net profit to maximum drawdown—is a significantly more honest risk metric than drawdown size alone. It measures how effectively the strategy compensates you for the risk you accepted. A -10% drawdown followed by a +50% gain represents high capital elasticity: the system takes a hit and deploys its recovery mechanism forcefully. A -10% drawdown followed by a +12% gain means you are working too hard for too little—the strategy is consuming risk without generating proportionate return.
The MAR Ratio—Compound Annual Growth Rate divided by Maximum Drawdown—formalizes this relationship into a single metric. It is the return-on-pain score: how much annualized return the strategy generates per unit of maximum drawdown accepted. A high MAR Ratio indicates that the strategy’s recovery mechanism is strong relative to its risk. A low MAR Ratio indicates that the strategy is inefficient—that the drawdown it produces is not being compensated by the returns it generates. This is the efficiency standard that drawdown size alone cannot provide.
3. The Psychological Cost of Slow Regains
A deep drawdown is an event. A slow recovery is a condition. Human psychology handles events—even severe ones—more effectively than it handles conditions, because events have visible endpoints and conditions do not.
When a strategy is in a deep, fast drawdown, the trader knows with certainty that the loss is occurring. The system’s behavior is dramatic and unambiguous. The crisis concentrates attention, activates the protocol, and produces a clear decision point. When a strategy is in a slow recovery, nothing dramatic is happening. The account is not losing—it is simply not gaining. The market around it is moving. Other instruments are performing. The quiet accumulation of foregone opportunity produces not a crisis response but a gradual erosion of confidence—the specific psychological process that leads to strategy abandonment at the worst possible moment.
By prioritizing recovery speed, the design objective shifts from minimizing the depth of the crisis to minimizing the duration of the condition. A system that returns to new highs quickly is a system that limits the window during which the confidence erosion can accumulate. It is the design choice that keeps the operator committed through the full statistical sample required for the edge to manifest.
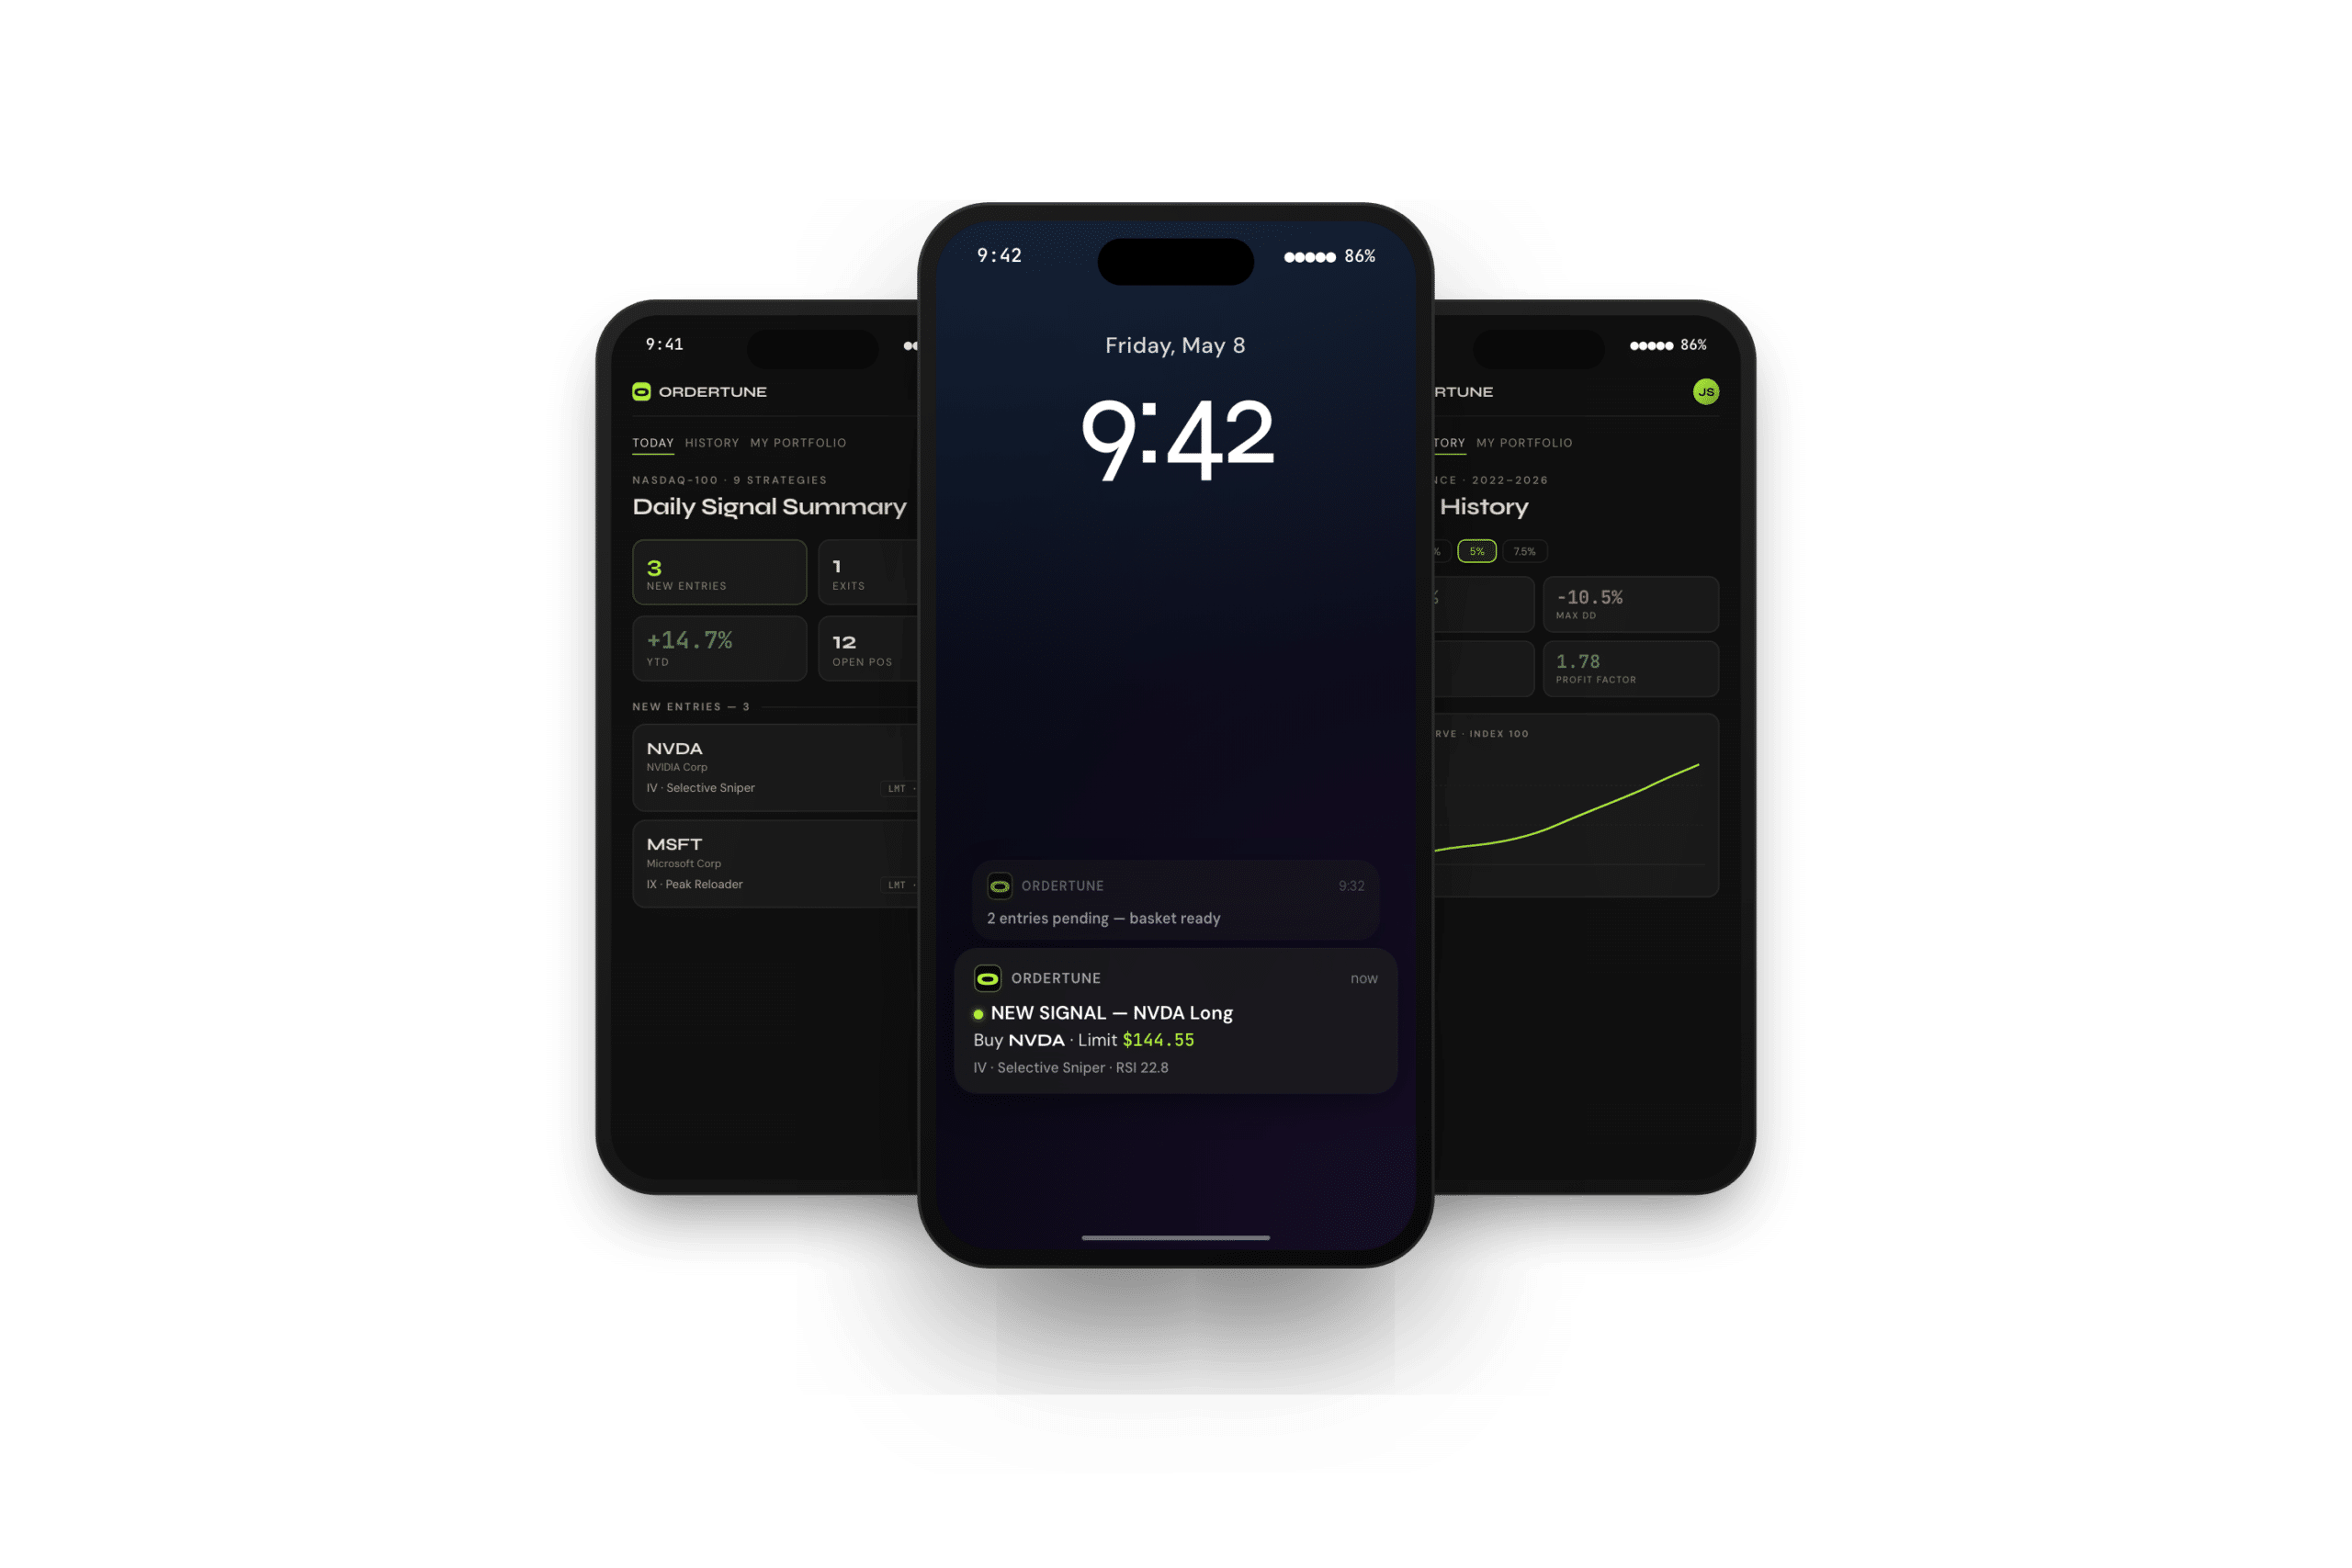
The Ordertune Perspective: Trading for Momentum
We don’t hide from volatility. We use it as the fuel for our recovery.
The Nasdaq 100 Engine: We focus on the Nasdaq because it is the most elastic growth engine in the world. When the market turns, the Nasdaq doesn’t just recover—it typically leads the new bull cycle. This structural speed is our primary defense against long-duration drawdowns. We are in the market with the shortest ladder out of the hole.
MAR Ratio over MDD: We evaluate strategies by their MAR Ratio—Compound Return divided by Maximum Drawdown—not by their drawdown size in isolation. We want a high return-on-pain score. If a strategy doesn’t recover with enough force to justify the drawdown it produces, it doesn’t pass the Protocol.
Liquidity as a Spring: Recovery speed requires liquidity. You cannot recover quickly in a market where you cannot get a fill at a rational price. By concentrating in the Nasdaq 100, we ensure that the recovery mechanism is structurally present and immediately available when the regime shifts.
The false comfort of low volatility is one of the most expensive misunderstandings in retail portfolio management. A strategy that displays a 3% maximum drawdown and a 4% annual return has a MAR Ratio of 1.3. A strategy that displays a 20% maximum drawdown and a 35% annual return has a MAR Ratio of 1.75. By the only metric that measures both the cost and the compensation simultaneously, the “risky” strategy is more efficient. The “conservative” strategy is paying out less per unit of risk accepted—and committing more of the operator’s time to recovery.
The question is never how deep the drawdown is in isolation. The question is always how quickly and how effectively the strategy recovers from it. Elasticity—the capacity to return to peak equity with force and speed—is the property that determines whether a drawdown is a temporary interruption or a permanent tax on compounding.
Model performance
The model curve over the window you pick, at the position size you pick. Equity, drawdown and market exposure come from the same daily snapshot a free Ordertune account reads — nothing here is computed in your browser.
Model performance from 22 October 2021 through 20 October 2026, at 3 % of equity per trade. The curve is drawn weekly over this window; the metrics are calculated on every trading day.
Model data through 20 October 2026. Rebuilt daily from the same figures a free Ordertune account sees.
What This Means for Your Strategy
When evaluating any strategy, compute three metrics alongside the MDD: the Recovery Factor, the MAR Ratio, and the median time-to-recovery from drawdowns of various magnitudes. A strategy with a high MDD but a strong Recovery Factor and MAR Ratio is generating high returns per unit of risk accepted. A strategy with a low MDD but a weak MAR Ratio is consuming risk without adequate compensation—and committing your capital to prolonged recovery phases that suppress compounding.
At Ordertune, the MAR Ratio is a primary design criterion. Every signal must generate enough return to justify the drawdown it produces, and the recovery must be fast enough to keep capital utilization high. We trade the Nasdaq 100 because its structural elasticity makes this possible. We want your capital working for the future—not stuck in the past repairing a drawdown that should have been over in weeks.
Stop measuring how deep the hole is. Start measuring how fast you climb out. That ratio is what determines whether you end up ahead.
Know the Risk
Key Terms Defined
If you don’t measure the speed, you are ignoring the cost of time.
The Recovery Factor is a performance metric calculated by dividing a strategy’s total net profit by its maximum drawdown. It measures how effectively the system compensates the operator for the worst loss it has historically produced. A Recovery Factor above 3 is generally considered indicative of a high-quality risk-return relationship; below 1 suggests the strategy is not generating sufficient return to justify the maximum risk it has imposed.
The No-BS Truth: The Recovery Factor is the metric that converts maximum drawdown from a standalone number into a meaningful risk assessment. A -20% drawdown with a Recovery Factor of 5 is a well-compensated risk. A -10% drawdown with a Recovery Factor of 0.8 means the strategy has not yet generated enough profit to cover its worst historical loss—a situation in which the operator is running a risk budget deficit. Evaluating drawdown without evaluating the Recovery Factor is measuring the cost without measuring the compensation.
The MAR Ratio (Managed Account Reports Ratio) is calculated by dividing a strategy’s Compound Annual Growth Rate by its Maximum Drawdown. It provides a standardized measure of annual return per unit of maximum drawdown accepted—effectively the return-on-pain score for a systematic strategy. A MAR Ratio above 1.0 means the strategy generates more than one percentage point of annualized return for every percentage point of maximum drawdown.
The No-BS Truth: The MAR Ratio is the most direct available measure of capital efficiency in a systematic strategy. It forces the evaluation to include both the cost—the maximum drawdown—and the compensation—the annualized return—in a single number. A strategy with a high MAR Ratio is generating high returns per unit of risk accepted. A strategy with a low MAR Ratio is consuming risk without adequate compensation. Ordertune uses the MAR Ratio as a primary filter because it is the metric that most honestly answers the question every investor should be asking: am I being paid enough for the risk I am taking?
Capital Elasticity is the capacity of a strategy to return to peak equity quickly and forcefully after a drawdown—the “spring-back” property of a trading system. A highly elastic strategy experiences losses that are followed by rapid, decisive recoveries driven by a strong underlying market mechanism. A low-elasticity strategy experiences losses that are followed by slow, grinding recoveries driven by weak or absent structural growth forces.
The No-BS Truth: Capital elasticity is determined by two factors: the strength of the market mechanism driving the strategy’s edge and the liquidity of the instrument being traded. A strategy built on a strong, persistent market inefficiency in a highly liquid instrument has the structural foundation for high elasticity. A strategy built on a weak edge in an illiquid instrument has neither—it will experience the losses of a volatile strategy and the recovery speed of a conservative one, which is the worst possible combination of risk properties.
Capital Utilization is the proportion of time an investment’s capital is actively generating new return rather than recovering from previous losses. A strategy with high capital utilization spends the majority of its time at or near all-time highs, where every dollar is compounding toward new growth. A strategy with low capital utilization spends a significant proportion of time in recovery, where capital is committed to repairing the past rather than building the future.
The No-BS Truth: Capital utilization is the opportunity cost metric made explicit. Every month a strategy is underwater, it is not compounding at its normal expected rate—and the foregone compounding during that period represents a real financial cost that does not appear in any performance summary. Recovery speed is the primary lever that controls capital utilization: strategies that recover quickly maximize the proportion of time capital is productively deployed. This is why recovery speed, not drawdown depth, is the variable that most directly determines the efficiency of a systematic strategy over any finite investment horizon.
Opportunity Cost in the context of trading drawdowns is the return foregone because capital is committed to recovering from a loss rather than being deployed in productive positions. It is the invisible tax of slow recovery—never visible on a performance statement, never captured in a drawdown percentage, but real and compounding with every week the account remains below its previous peak.
The No-BS Truth: Opportunity cost is the dimension of drawdown risk that is most consistently ignored and most consistently expensive. A -10% drawdown that takes two years to recover does not cost 10%—it costs 10% plus two years of compounding at the strategy’s expected rate. The longer the recovery, the larger the true cost. This is why a fast -20% recovery can be less expensive than a slow -10% recovery over any sufficiently long holding period, and why capital elasticity—not drawdown depth—is the correct primary criterion for evaluating the true cost of risk.
Because the total cost of a drawdown includes not just the percentage lost but the time during which capital is not compounding. A -20% drawdown that resolves in three weeks imposes a brief opportunity cost and returns capital to productive deployment almost immediately. A -10% drawdown that resolves over two years imposes two years of foregone compounding at the strategy’s expected rate—a total cost that almost certainly exceeds the 10% loss in absolute terms. Recovery speed determines capital utilization, and capital utilization determines the true efficiency of the strategy over any finite holding period. Depth alone does not.
The MAR Ratio divides a strategy’s Compound Annual Growth Rate by its Maximum Drawdown, producing a standardized return-on-pain score. A MAR Ratio of 1.0 means the strategy generates one percentage point of annual return for every percentage point of maximum drawdown. A ratio of 2.0 means it generates twice as much return per unit of worst-case loss. Use the MAR Ratio to compare strategies with different risk profiles on an equal footing: a strategy with a 30% MDD and a 45% CAGR (MAR 1.5) is more capital-efficient than one with a 10% MDD and a 12% CAGR (MAR 1.2), even though the second strategy looks “safer” by the drawdown metric alone.
Because volatility measures the amplitude of price movements, not the efficiency of the recovery process. A low-volatility strategy may have a small maximum drawdown but recover from it at such a slow rate that the opportunity cost of the recovery exceeds the drawdown itself. A high-volatility strategy may have a large maximum drawdown but recover from it so quickly that the total time capital spends unemployed is minimal. The risk that matters for compounding is not the depth of the worst event—it is the proportion of time capital is not growing. Low volatility strategies often score poorly on this metric because their recovery mechanism is as weak as their drawdown protection is strong.
Recovery speed requires that re-entry into profitable positions is available immediately when the regime shifts. In illiquid markets, recovery is constrained by the market’s inability to absorb position rebuilding at rational prices—bid-ask spreads widen, market depth collapses, and the process of re-establishing exposure after a drawdown imposes additional friction costs that extend the recovery timeline. In highly liquid markets like the Nasdaq 100, re-entry is available at any size almost instantaneously when conditions improve, and the market’s inherent structural growth engine provides the directional force that drives recovery once the adverse regime has passed. Liquidity is the prerequisite for elasticity.
The Ordertune Protocol optimizes for recovery speed through three mechanisms. First, by concentrating exclusively in the Nasdaq 100, it ensures that the recovery mechanism—the structural growth engine of the world’s most liquid equity index—is always available when the regime shifts. Second, by using regime-based exposure management, it reduces participation during environments where recovery is historically slow and increases it during environments where recovery is historically fast—keeping capital utilization high across the full market cycle. Third, by using the MAR Ratio as a primary design criterion, every strategy component must justify its drawdown contribution with sufficient return to ensure that the recovery-to-risk ratio remains above the Protocol’s threshold. The goal is not to minimize drawdowns. It is to ensure that every drawdown produces a faster, larger recovery than it costs.
The Reality Check
"A -20% hit is a wound. A slow recovery is an infection. One you can heal from; the other will slowly kill your account."
The Bottom Line
Risk is not a percentage. It is a function of time and efficiency. A strategy that suffers deep drawdowns but recovers with explosive speed is often structurally superior to a stable strategy that stays underwater for years—because the former keeps capital utilization high and the operator’s discipline intact, while the latter slowly taxes both.
At Ordertune, we prioritize the MAR Ratio and the Recovery Factor because they are the metrics that measure risk honestly—including the time dimension that MDD ignores. We trade the Nasdaq 100 because its structural elasticity provides the fastest available recovery mechanism in equity markets. We want capital working for the future, not committed to repairing a drawdown that should have been resolved in weeks.
Stop measuring how deep the hole is. Start measuring how fast you climb out. That ratio is what determines whether you end up ahead.
High-Quality Resources
- Thomas Stridsman — Trading Systems That Work: A rigorous treatment of the MAR Ratio, Recovery Factor, and capital efficiency metrics—demonstrating why return-on-pain measures provide a more complete risk assessment than drawdown depth alone and how they should inform strategy selection and position sizing.
- Ralph Vince — The Mathematics of Money Management: The mathematical framework for understanding capital utilization, opportunity cost, and the relationship between drawdown depth, recovery speed, and long-term compounding—establishing why time is a risk variable of equal importance to percentage loss.
Three different Plans. One Goal. Your Choice.
Core Exposure
The Entry Point. Built for Smaller Portfolios
€129
excl. VAT
- Curated Selection suited for smaller portfolios
- Broker connection (IBKR via the bridge)
- One-Click Execution via your own Interactive Brokers account
- Send orders to your broker in bulk
- Custom position sizing
- Cancel Monthly
The Foundation. Start with Discipline.
Core is your entry into systematic trading. A curated selection of institutional strategies follows fixed rules on the Nasdaq-100. Every signal — every entry, every exit — appears in your Ordertune Terminal. Execution stays fully in your hands.
Who It's For: Core suits smaller portfolios and anyone who wants to start trading systematically. As your capital grows, Advanced spreads the risk across a broader selection of strategies. We don't sell financial advice; we sell a clear, repeatable protocol that you decide to follow.
Advanced
Broader Diversification. Built for Growing Portfolios
€279
excl. VAT
- Selected strategies with live signals
- Broker connection (IBKR via the bridge)
- One-Click Execution via your own Interactive Brokers account
- Send orders to your broker in bulk
- Custom position sizing
- Cancel Monthly
The Professional Standard.
Advanced adds strategies with different approaches to the selection. That spreads the risk and is designed to smooth the equity curve. You release each signal yourself in the Ordertune Terminal. Only then does the bridge on your own server collect what you released and place the order in your own Interactive Brokers account. We never hold your broker credentials, and nothing is ever executed that you did not release.
The Requirement: You follow the rules, even when it feels wrong in the moment. Advanced is for those who trade with discipline, not for those who need to be right. All it takes is a cool head.
Institutional Alpha
Full Strategy Suite. Built for Scale
€489
excl. VAT
- All strategies with all signals, long and short
- Broker connection (IBKR via the bridge)
- Additional Diversification Strategies for Larger Books
- One-Click Execution via your own Interactive Brokers account
- Send orders to your broker in bulk
- Custom position sizing
- Cancel Monthly
Built for Capital that Outgrows Single-Strategy Risk.
At higher capital levels, the same strategy set produces larger positions — and concentration, slippage and market impact start eating into your edge. Institutional Alpha addresses this with the full strategy portfolio: additional, weakly correlated strategies on both the long and the short side, built specifically for diversification at scale. More strategies, smaller per-position exposure, a smoother equity curve.
Who This Is For: This tier is for serious capital. Below roughly $200k, Advanced delivers the same core without paying for diversification you don't yet need. Above that threshold, the broader setup starts working for you. The short strategies require a margin-enabled brokerage account. Consistent adherence to the protocol is expected.
Strategies per tier
Which trading strategies you get with which Ordertune tier. Access is determined by the tier you subscribe to — not by how long you have been a member, and not by account size.
| Strategy | Ordertune CoreEUR 129/mo excl. VAT | Ordertune AdvancedEUR 279/mo excl. VAT | Institutional AlphaEUR 489/mo excl. VAT |
|---|---|---|---|
| Peak Reload | Included in Ordertune Core | Included in Ordertune Advanced | Included in Institutional Alpha |
| Rotator | Included in Ordertune Core | Included in Ordertune Advanced | Included in Institutional Alpha |
| Selective Sniper | Included in Ordertune Core | Included in Ordertune Advanced | Included in Institutional Alpha |
| Trend Quality Rebound | Included in Ordertune Core | Included in Ordertune Advanced | Included in Institutional Alpha |
| Weekly Pulse | Included in Ordertune Core | Included in Ordertune Advanced | Included in Institutional Alpha |
| Deep Dip | Not included in Ordertune Core | Included in Ordertune Advanced | Included in Institutional Alpha |
| Intraday Liquidity Hunter | Not included in Ordertune Core | Included in Ordertune Advanced | Included in Institutional Alpha |
| Panic Reversal | Not included in Ordertune Core | Included in Ordertune Advanced | Included in Institutional Alpha |
| Precision Panic Predator | Not included in Ordertune Core | Included in Ordertune Advanced | Included in Institutional Alpha |
| Selective Compounder | Not included in Ordertune Core | Included in Ordertune Advanced | Included in Institutional Alpha |
| Alltime Shield I | Not included in Ordertune Core | Not included in Ordertune Advanced | Included in Institutional Alpha |
| Alltime Shield II | Not included in Ordertune Core | Not included in Ordertune Advanced | Included in Institutional Alpha |
| Alltime Shield III | Not included in Ordertune Core | Not included in Ordertune Advanced | Included in Institutional Alpha |
| Alltime Shield IV | Not included in Ordertune Core | Not included in Ordertune Advanced | Included in Institutional Alpha |
| Breakout Hunter | Not included in Ordertune Core | Not included in Ordertune Advanced | Included in Institutional Alpha |
| Day Ripper | Not included in Ordertune Core | Not included in Ordertune Advanced | Included in Institutional Alpha |
| Fast Predator | Not included in Ordertune Core | Not included in Ordertune Advanced | Included in Institutional Alpha |
| Momentum Powerhouse | Not included in Ordertune Core | Not included in Ordertune Advanced | Included in Institutional Alpha |
| Monthly Weakness | Not included in Ordertune Core | Not included in Ordertune Advanced | Included in Institutional Alpha |
| Panic Shield | Not included in Ordertune Core | Not included in Ordertune Advanced | Included in Institutional Alpha |
| Reverse | Not included in Ordertune Core | Not included in Ordertune Advanced | Included in Institutional Alpha |
| Risk-Flow Arbitrage | Not included in Ordertune Core | Not included in Ordertune Advanced | Included in Institutional Alpha |
| Shield | Not included in Ordertune Core | Not included in Ordertune Advanced | Included in Institutional Alpha |
| Short Bullrun | Not included in Ordertune Core | Not included in Ordertune Advanced | Included in Institutional Alpha |
| Tech Compounder | Not included in Ordertune Core | Not included in Ordertune Advanced | Included in Institutional Alpha |
| Start Ordertune Core | Start Ordertune Advanced | Start Institutional Alpha |
Read from the Ordertune strategy registry on 20 October 2026 — 25 strategies across 3 tiers.

Related Posts

4.6 Warum Korrelationen unter Stress ihr wahres Gesicht zeigen.
Korrelationen unter Stress verhalten sich grundlegend anders als im…

4.6 Why Correlations Reveal Their True Nature Under Stress.
Relying on average historical correlations to build a portfolio is like…

4.5 Warum leicht veränderte Parameter keine Strategie-Diversifikation sind.
Andere Parameter machen aus einer Strategie noch keine zweite. Drei…